The COVID-19 pandemic has profoundly affected life as we knew it in the U.S. Small businesses may have been particularly vulnerable: the typical small business pre-pandemic had cash reserves to cover 15 days of outflows in the event of a total disruption in revenues. After the national emergency was declared on March 13, 2020, small businesses saw substantial revenue declines. Expenses also declined commensurately, reflecting lower revenues as well as efforts to preserve liquidity (Farrell et al., 2020).
The CARES Act created several relief programs, including Paycheck Protection Program (PPP), Economic Injury Disaster Loan (EIDL) advances, and Economic Impact Payments (EIP). The signature program for small businesses was the PPP, which authorized $659 billion towards job retention. One of its objectives is stated plainly by its name: it was intended to provide funds so that small businesses would continue to pay their employees instead of resorting to furloughs or layoffs. The maximum loan amount available to applicants was based on average monthly payroll, and the loan could be forgiven if 60 percent was used for payroll and other eligible expenses within 24 weeks. 1 Another objective was to get cash to small businesses quickly, requiring minimal documentation and leveraging infrastructure at financial institutions to distribute the loans.
Ultimately, 5.2 million loans were approved before the PPP closed on August 8, 2020, comprising a total of over $525 billion (Small Business Administration, 2020). Given the magnitude of the program, policymakers will be interested in its effects, especially as longer term small business outcomes emerge. JPMC Institute data can provide initial insight into loan amounts relative to all operating expenses as well as small business cash flows in the weeks before and after the PPP loans were disbursed. Our research was completed before the Coronavirus Response and Relief Supplemental Appropriations Act of 2021, which reopens the program, was signed into law on December 27, 2020.
We used a sample of small businesses with Chase Business Banking deposit accounts and PPP loans from any lender 2 and focus on two cohorts. Approximately 20 percent of the firms in the sample received funds from a lender other than Chase. Our main sample is comprised of over 160,000 firms receiving PPP loans in May, when the majority of PPP loans were disbursed. The typical PPP loan in May was $25,000, and we can observe up to 25 weeks of cash flow data after loan funds were received, 3 through the end of October 2020.
To analyze the cash flows of firms receiving PPP loans later in the pandemic, we used a cohort of over 11,000 firms that received PPP loans in July. The typical loan in July was $11,000, notably smaller than in May. We observe up to 16 weeks of cash flow data after the loan funds posted to their accounts.
The PPP was designed to provide funds for up to 8 weeks of payroll costs including benefits, with the maximum loan amount based on average monthly payroll (Department of the Treasury, 2020). Notably, the vast majority of small businesses are nonemployers but nevertheless provide livelihoods for their owners. For these firms, the loan amount was based on net profit (Small Business Administration, 2020). Although up to 40 percent of the loan could be used for non-payroll expenses and still qualify for loan forgiveness, payroll was the target of this program. Small businesses, particularly those in industries in which payroll is a smaller share of expenses, may have large non-payroll expenses, such as commercial leases. For them, a program supporting payroll may provide a relatively small fraction of what they need to sustain the business through this national emergency.
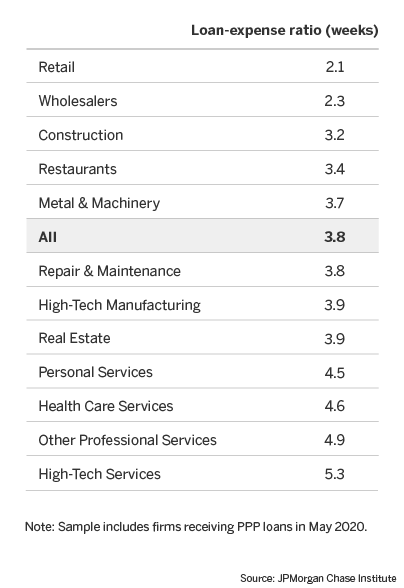
Table 1: The median PPP loan could cover 3.8 weeks of expense

| Loan-expense ratio (weeks) | |
| Retail | 2.1 |
| Wholesalers | 2.3 |
| Construction | 3.2 |
| Restaurants | 3.4 |
| Metal & Machinery | 3.7 |
| All | 3.8 |
| Repair & Maintenance | 3.8 |
| High-Tech Manufacturing | 3.9 |
| Real Estate | 3.9 |
| Personal Services | 4.5 |
| Health Care Services | 4.6 |
| Other Professional Services | 4.9 |
| High-Tech Services | 5.3 |
Note: Sample includes firms receiving PPP loans in May 2020.
Source: JPMorgan Chase lnstitute
We used cash flow data to estimate the number of weeks of expenses the typical PPP loan could cover. Table 1 shows the median ratio of loan amount to the average weekly expenses in 2019 for the typical firm receiving a PPP loan in May. The median loan-expense ratio of 3.8 indicates that loan proceeds could cover 3.8 weeks of expenses. However, the loan-expense ratio ranged from 2.1 weeks for retail to 5.3 weeks for high-tech services. In industries where payroll tends be a large share of expenses, such as professional and high-tech services, loans covered more weeks of expenses. While industries such as retail and restaurants also rely on employees, those industries may also have large shares of expenses devoted to rent and inventory.
We observe payroll for 35 percent of firms in this sample, and among these firms, payroll accounted for 18 percent of weekly expenses in 2019. These shares may not reflect the cost of payroll-related expenses, such as health insurance or other benefits which would be included in determining PPP loan amounts. Nevertheless, they provide some insight into the magnitude of expenses small businesses have in addition to payroll. Extrapolating from the 3.8 weeks of expenses covered by a typical PPP loan, if payroll represents 20 percent of expenses, the loan proceeds could stretch over 19 weeks of only payroll. If payroll were 33 percent of expenses, then the loan could cover 11 weeks of just payroll.
The PPP was designed to support small business payroll, and it is therefore not surprising that it has been better-suited for firms in which payroll is a large share of expenses. However, payroll is just one of the many expenses small businesses face, and policymakers should consider that relief for small businesses needs to encompass more than payroll assistance.
While the loan-expense ratios provide pertinent context about the sizes of loans relative to business operations, they do not show how small business finances have evolved over the course of a pandemic which is now measured in months, not weeks. Despite restrictions due to the public health emergency and reduced demand for their goods and services, many small businesses have been resilient and adapted. Although there are differences by industry, many firms have cut expenses and found new ways to serve their customers, thereby providing some revenues and preserving cash (Farrell, Wheat, and Mac, 2020b).
Figure 1: PPP loans substantially increased cash balances, supporting expenses while revenues were depressed
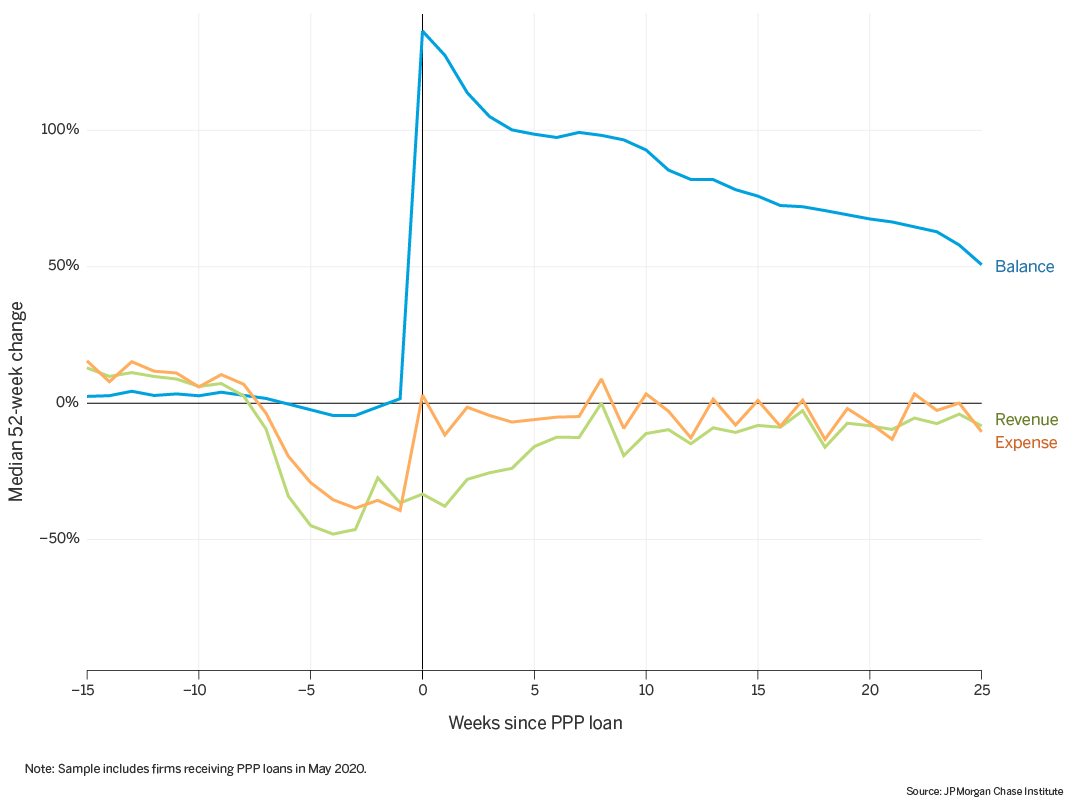
Line graph showing changes in balances, expenses, and revenues in the weeks after PPP loan funds were received in May 2020. Loan funds bolstered balances with a median increase of 136 percent. That same week, median expenses were 3 percent higher than in the previous year, but median revenues were 33 percent lower than a year ago.
Figure 1 shows the trajectory of typical changes in balances, expenses, and revenues in the weeks after PPP loan funds were received in May. Week 0 represents the week in which the loan funds became available to the firm, and the figure shows the median within-firm percentage change in balances, expenses, and revenues compared to the same week in the prior year. The loan funds bolstered balances substantially, with a median increase of 136 percent, more than doubling balances relative to the prior year.
That same week, median expenses were 3 percent higher than they were in the previous year, particularly notable because expenses declined in the weeks leading up to the loan disbursement. In the week prior to loan disbursement, expenses were 39 percent lower compared to the prior year. The increase in expenses did not correspond to an increase in revenues: in week 0, median revenues were 33 percent lower than a year ago. In the following weeks, expense growth remained somewhat higher than revenue growth, while balance growth declined. This suggests that PPP loan funds allowed firms to incur operating expenses that would not be supported by the concurrent revenue stream. Although expense growth recovered materially after loan disbursement, it remained somewhat lower than they were a year ago. Twenty-five weeks after loan disbursement—mid-October—expense growth was 10 percent lower than in the prior year.
Balances remained elevated in the weeks after loan disbursement: in week 25, median balances were 50 percent higher than the prior year. This may be due to a combination of recovering revenues and conservative expense management. This does not mean that individual firms experienced gradual declines in their balances as loan proceeds were spent. Small business cash flows can be volatile, and balances are replenished and depleted as revenues recovered and expenses were incurred. However, this perspective on the median change each week provides a view of the aggregate trend. That is, PPP bolstered firm cash balances, and those balances remain elevated relative to the prior year. This is consistent with survey data collected by the Census Bureau. 4 However, higher balances do not indicate that small businesses have recovered. Expenses and revenues remain lower compared to the prior year, suggesting that firms may be limiting expenses in order to maintain liquidity (Farrell et al., 2020).
Figure 2: In the weeks after loan disbursement, restaurant expenses remain lower than the prior year despite elevated cash balances
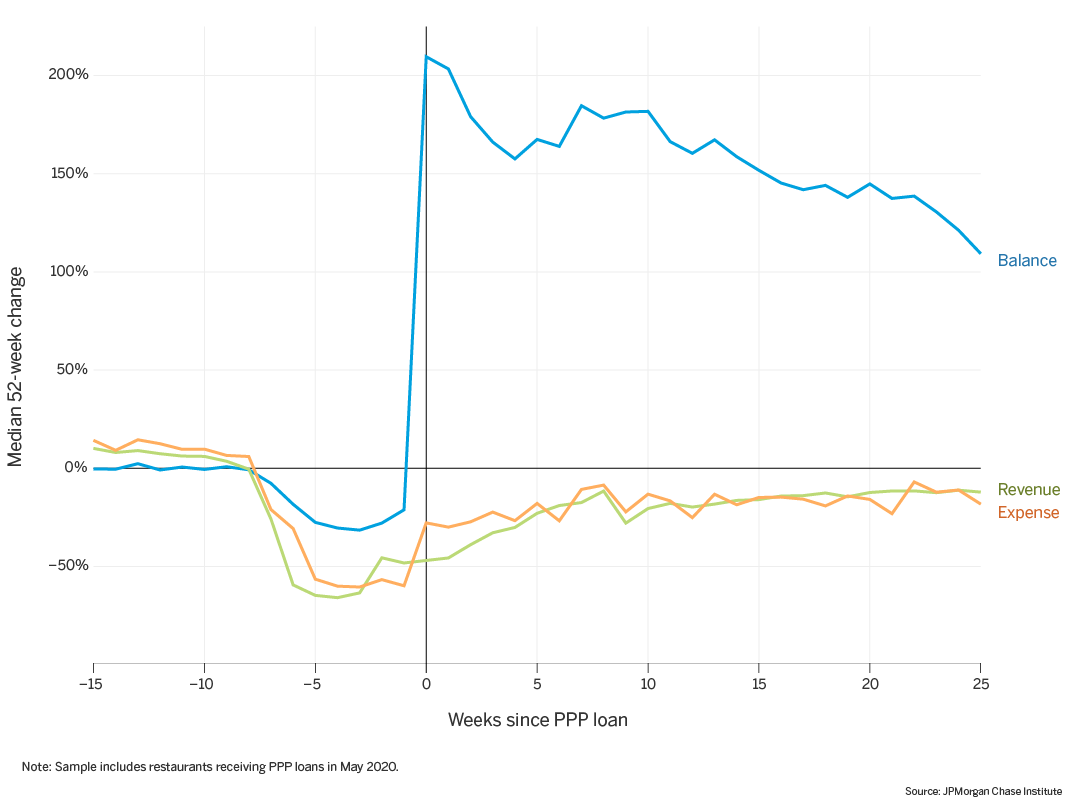
Line graph showing balances, revenue, and expenses of restaurants receiving PPP loan funds in May. In the weeks prior to loan disbursement, balances were more than 30 percent lower than the prior year, compared to a decrease of less than 5 percent across all firms in this sample. Revenues and expenses were approximately 60 percent lower than the prior year. Upon loan disbursement, balances increased more than 200 percent compared to a year ago.
Restaurants and personal services are two industries that have been particularly hard hit during this pandemic. While their cash balances growth after receiving PPP was not unlike those of other firms, their depressed expenses and revenues suggest that balances alone do not indicate financial health.
Figure 2 shows restaurants receiving PPP loan funds in May. In the weeks prior to loan disbursement, balances were more than 30 percent lower than the prior year, compared to a decrease of less than 5 percent across all firms in this sample. Revenues and expenses were approximately 60 percent lower than the prior year. Upon loan disbursement, balances increased more than 200 percent compared to a year ago. This median change in balance is higher than what we observe across all firms partly because the typical restaurant had lower than median balances pre-pandemic and partly because the median PPP loan to restaurants was larger than the typical PPP loan.
Similar to firms in other industries, restaurants increased their expenses in the week in which the loan funds were available. However, expenses did not increase by the same magnitude observed among all firms, with expense growth increasing from –60 percent to –28 percent in week 0. In week 25 (October) expenses were 18 percent lower although balances were twice as high as in the prior year.
Figure 3: PPP funds increased balances of personal service firms, supporting expenses
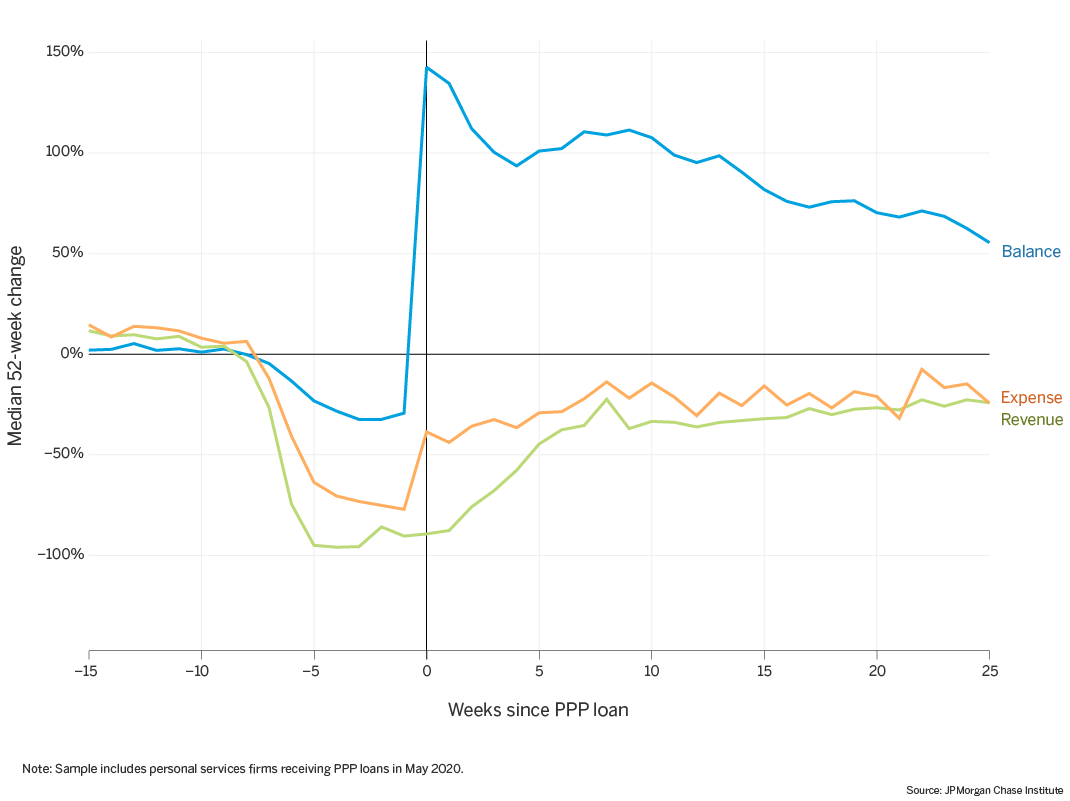
Line graph showing balances, revenue, and expenses of personal services firms receiving PPP loan funds in May. Balances and revenues were depressed in weeks prior to loan disbursement, but did increase upon receipt of loan funds despite little change in revenues. The increase in cash balances was not as large as for restaurants. In week 25, expenses were 24 percent lower than a year ago.
Personal service firms receiving PPP loans displayed a similar trajectory, as shown in Figure 3. Balances, expenses, and revenues were materially depressed in the weeks prior to loan disbursement. Upon receipt of loan funds, expenses increased despite little change in revenues. The increase in cash balances was not as large as for restaurants, and like restaurants, the increase in expenses still left expenses materially lower than the prior year. In week 25, expenses were 24 percent lower than a year ago.
The PPP substantially bolstered cash balances of firms, providing support for ongoing expenses during a period in which revenues have not fully recovered. Balances remained elevated in October, 25 weeks after loans were disbursed, as firms moderated expenses relative to revenues.
The PPP intended to get cash into the hands of small businesses quickly by streamlining the application process and leveraging infrastructure at financial institutions. The first $349 billion was depleted in just two weeks. Applications resumed on April 27, 2020 after an additional $310 billion was authorized. In our sample, the majority of firms with PPP loans received the funds in May, which was timely given the sharp revenue declines in April (Farrell, Wheat, and Mac, 2020a, 2020b; Opportunity Insights Economic Tracker, 2020).
To provide insight into the financial health of small businesses receiving PPP loans in later months, we analyzed a cohort of over 11,000 firms with loans in July. There may be a number of reasons why some firms applied for and received loans later. They may have needed more time to gather the necessary documentation, or they may have hesitated to apply without clarity on qualifying for loan forgiveness. These firms were typically smaller, with lower median balances pre-pandemic and loan sizes than those receiving loans in May. A larger share of this cohort also received EIDL advances or EIP, 5 compared to the May cohort.
Balance growth was positive in the weeks before July PPP loans were disbursed, likely bolstered by other relief programs and transfers
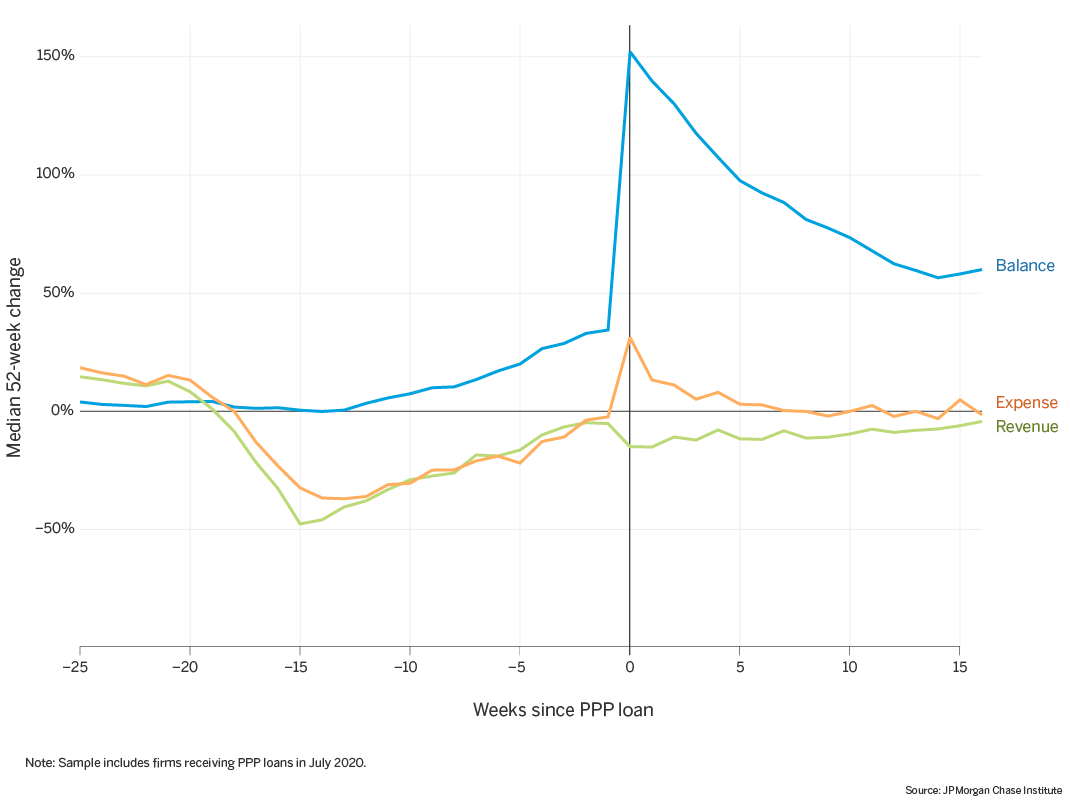
Line graph showing balances, revenue, and expenses of a cohort of firms that received PPP loans later in the year, specifically, small businesses that received PPP loans in July rather than May. Balances increase in the week that PPP loan funds became available, along with an increase in expenses without a corresponding increase in revenues. The median increase in expenses in week 0 is over 30 percent higher than a year ago.
Similar to the May cohort, balances increase materially in the week that PPP loan funds became available to the firm, accompanied by an increase in expenses without a corresponding increase in revenues. The median increase in expenses in week 0 is substantial, over 30 percent higher than a year ago. For the May cohort, the increase had brought expenses to approximately the levels of the prior year. In subsequent weeks, median balance growth declines but remained elevated as of October, relative to the prior year.
In the weeks leading up to PPP loan disbursement, median balance growth was, perhaps surprisingly, positive. During these weeks, revenues and expenses were recovering but nevertheless lower than in the prior year. Despite this, median balance growth was positive starting approximately in April, 12 weeks before the PPP loan disbursement in July. As noted earlier, a larger share of the July cohort received EIDL advances or EIP. EIDL advances were emergency grants of up to $10,000, made available in April as part of the CARES Act, and EIP started arriving in mid-April. A combination of relief programs, recovering revenues, and possibly other financial inflows (e.g., transfers from personal accounts, other borrowing) provided liquidity until PPP funds were obtained. More research is needed to analyze the relative roles of the different relief programs.
The PPP was an unprecedented attempt at providing liquidity to and supporting the payroll of small businesses. The program was designed to support payroll for eight weeks but later allowed more flexibility in timing and the share spent on payroll. This brief provides insight into PPP loan amounts relative to operating expenses as well as a view of the trajectory of typical small business cash balances, revenues, and expenses in the weeks after receiving PPP loan funds. With this context in mind, we offer the following implications for leaders and decision makers seeking to sustain the sector and support its recovery:
Relief programs based on payroll address just one of the expenses small businesses face. The PPP was designed to support payroll, but the vast majority of small businesses are non employers. For these firms, as well as those with large non-payroll expenses, PPP loans could sustain fewer weeks of operations. Moreover, Black- and Latinx-owned small businesses are also less likely to have employees, limiting the relief available to them. Future relief should consider the needs of the small business as well as those of its employees.
PPP supported increases in expenses when revenues remained depressed, but small businesses may be preserving liquidity by limiting expenses. When cash balances increased upon loan disbursement, firms immediately and materially increased expenses, compensating for the prior weeks of much lower expenses. However, expenses did not return to pre-pandemic levels, perhaps in an effort to maintain liquidity. Balances remained elevated weeks after loan disbursement, while revenues and expenses continue to be lower than they were a year ago.
Other relief programs contributed to liquidity, particularly for firms accessing PPP later. The PPP was not the only program supporting small businesses. EIDL advances, EIP, and other transfers likely provided needed liquidity early in the pandemic, particularly for smaller small businesses. State and local programs have also supported small businesses with loans and other assistance, often focusing on smaller firms. 6 , 7
We thank Nicholas Tremper and Anuradha Raghuram for their hard work and vital contributions to this research. Additionally, we thank Courtney Hacker, and Sruthi Rao for their support. We are indebted to our internal partners and colleagues, who support delivery of our agenda in a myriad of ways, and acknowledge their contributions to each and all releases.
We would like to acknowledge Jamie Dimon, CEO of JPMorgan Chase & Co., for his vision and leadership in establishing the Institute and enabling the ongoing research agenda. We remain deeply grateful to Peter Scher, Head of Corporate Responsibility, Heather Higginbottom, President of the JPMC PolicyCenter, and others across the firm for the resources and support to pioneer a new approach to contribute to global economic analysis and insight.
Farrell, Diana, Chris Wheat, and Chi Mac. 2020a. “Small Business Financial Outcomes during the Onset of COVID-19.” JPMorgan Chase Institute.
Farrell, Diana, Chris Wheat, and Chi Mac. 2020b. “Small Business Financial Outcomes during the COVID-19 Pandemic.” JPMorgan Chase Institute..
Farrell, Diana, Chris Wheat, Chi Mac, and Bryan Kim. 2020. “Small Business Expenses during COVID-19.” JPMorgan Chase Institute.
Opportunity Insights Economic Tracker, Small Business Revenue. 2020. https://tracktherecovery.org/?s91z8.
“Paycheck Protection Program: How to Calculate Maximum Loan Amounts – by Business Type.” U.S. Small Business Administration. June 26, 2020. https://www.sba.gov/sites/default/files/2020-06/How-to-Calculate-Loan-Amounts-508_1.pdf.
“The CARES Act Provides Assistance to Small Businesses.” U.S. Department of the Treasury. https://home.treasury.gov/policy-issues/cares/assistance-for-small-businesses.
U.S. Census Bureau. 2020. Small Business Pulse Survey. https://portal.census.gov/pulse/data/.
Originally, 75 percent of the loan proceeds were to be used for payroll costs within eight weeks. https://home.treasury.gov/news/press-releases/sm1026
Customers may have originated their PPP loan through another entity and deposited funds into Chase Business Banking accounts.
In our analyses, the weeks since PPP loan funds were received were calculated relative to the date when the transaction posted to the account and the firm had access to the loan funds. These weeks may occur at different calendar dates. We alternatively described the posted transaction as the loan disbursement or receipt of loan funds, which simplifies the process by which loan funds were credited to accounts. Parties may have been aware of pending transactions before they were posted.
Data from the U.S. Census Bureau’s Small Business Pulse Survey, which covers employer businesses, suggest that the amount of cash on hand has increased since April 2020. For example, during the week of October 4, 2020, 26.9 percent of small businesses reported having cash on hand sufficient for more than three months of business operations, compared to 16.7 percent during the week of April 26 th .
Authorized by the CARES Act, these payments were made to eligible individuals as opposed to firms. However, the majority of small businesses at large and in our sample are nonemployer firms. Pass-through entities, such as sole proprietorships, report net income on their owners’ tax returns. If those tax returns used the business’s direct deposit information, the payments would have been deposited into the business checking accounts.
For example, the New York Forward Loan Fund is a state loan program for small businesses with 20 or fewer employees.
The state of Illinois’s Business Interruption Grant provided economic relief for industries and communities that have been disproportionately impacted by the pandemic.